

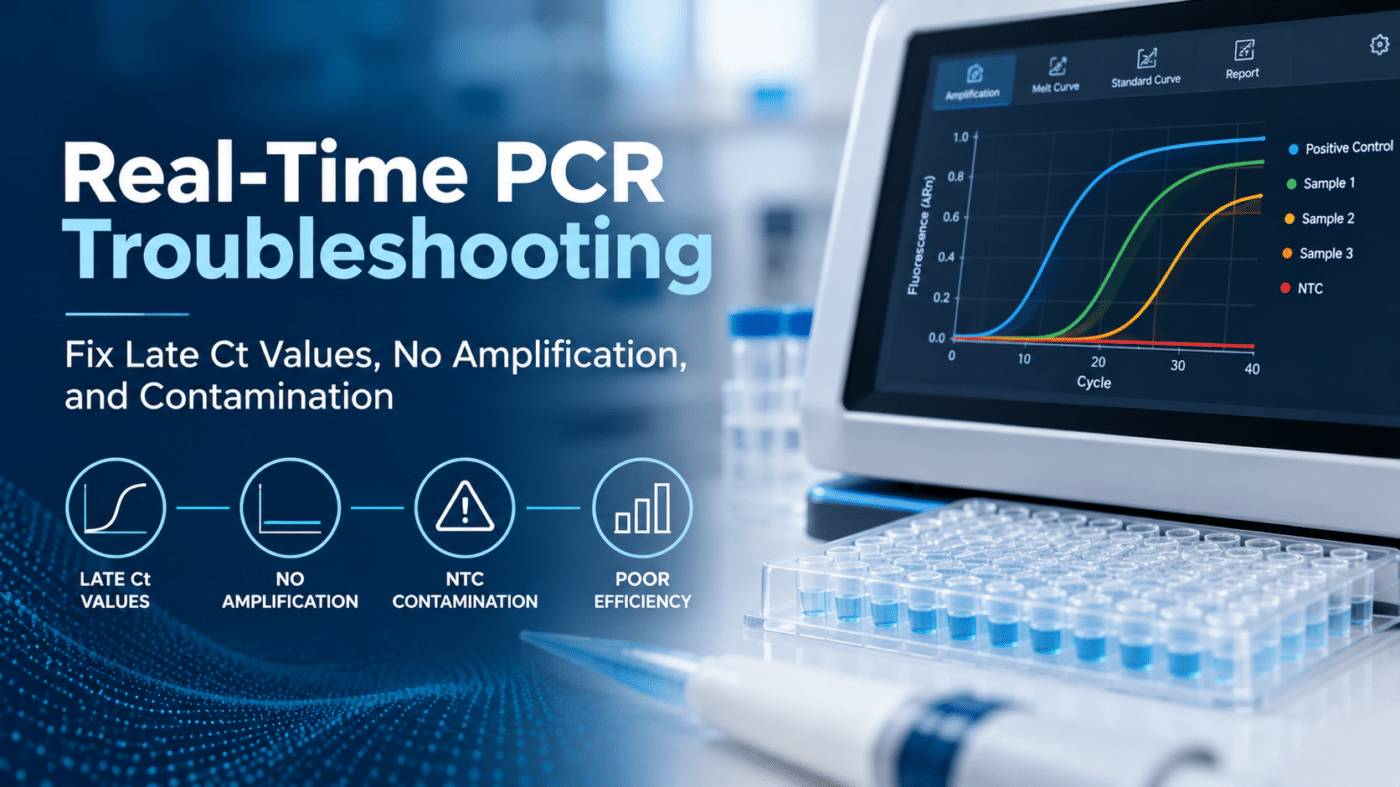
Every laboratory running real-time PCR eventually encounters unexpected results: a flat amplification curve, Ct values that shift later than expected, or amplification in a no-template control (NTC).
These problems can originate from sample quality, extraction, reagents, assay setup, or instrument settings. Identifying the cause requires a systematic approach rather than changing multiple variables at once.
This real-time PCR troubleshooting guide covers common amplification problems, their possible causes, and practical steps laboratories can take to improve workflow consistency.
Where to Start: A Systematic Approach to PCR Troubleshooting
Before troubleshooting an unexpected result, consider four questions:
- Did the controls perform as expected? Positive, negative, and internal controls can help identify where a problem occurred.
- Is the issue isolated or widespread? A single failed well may suggest sample preparation or pipetting issues, while failures across an entire plate may indicate reagent, instrument, or setup problems.
- What changed recently? Review reagent lots, extraction procedures, instrument maintenance, sample types, and operator changes.
- Could extraction be contributing? Poor nucleic acid recovery or inhibitor carryover can affect amplification. See our guide to nucleic acid extraction for PCR and NGS.
Document observations and investigate one potential cause at a time whenever practical.
Real-Time PCR Troubleshooting: Quick Reference
PCR Troubleshooting at a Glance
Identify common symptoms, possible causes, and what to check first.
| Problem | Possible Causes | What to Check First |
|---|---|---|
| No amplification, including positive control | Reagent or setup errors, incorrect cycling conditions, detection settings | Master mix, reagent storage, cycling program, fluorescence channels |
| No amplification in samples only | Target absence, inhibition, extraction failure, degraded template | Internal control, extraction quality, sample integrity |
| Late Ct values | Low template concentration, inhibitors, reagent degradation | Template input, control Ct values, reagent history |
| Amplification in NTC | Contamination, amplicon carryover, primer-dimers in dye-based assays | Fresh reagents, workspace separation, melt curve |
| Variable replicates | Pipetting errors, poor mixing, evaporation, low target concentration | Pipette calibration, plate sealing, sample input |
| Poor PCR efficiency | Dilution errors, inhibition, assay conditions | Standard curve preparation, slope, reaction conditions |
| Abnormal amplification curves | Incorrect baseline or threshold settings, bubbles, optical interference | Raw fluorescence, analysis settings, plate condition |
| Internal control failure | Inhibition, extraction issues, setup errors, multiplex competition | Extraction QC, control preparation, assay instructions |
Free Printable PDF | Quick Reference Guide
1. No Amplification in Real-Time PCR
When a reaction produces no detectable amplification, begin by reviewing the control results.
If the Positive Control Fails
A failed positive control may indicate a problem with reagents, reaction preparation, instrument settings, or control material.
Check that:
- All required reaction components were added correctly.
- Reagents were stored according to manufacturer instructions.
- Cycling conditions match the assay protocol.
- Appropriate fluorescence channels and dyes were selected.
- The positive control was prepared and handled correctly.
If Only the Samples Fail
If the positive control amplifies but samples do not, consider target absence, extraction efficiency, sample degradation, or amplification inhibition.
Review the internal control and relevant extraction controls.
Where appropriate for the assay, a controlled template dilution study may help investigate inhibition. Because dilution also reduces target concentration, results must be interpreted against the expected Ct shift and assay requirements.
2. Late or Unexpected Ct Values
An unexpectedly high Ct value may indicate reduced amplifiable target, inhibition, or changes in reaction performance.
Common causes include:
- Low template concentration: Insufficient target material may delay amplification.
- Degraded nucleic acids: Improper handling or storage can affect template quality, particularly for RNA.
- PCR inhibitors: Residual ethanol, heme, heparin, salts, or other substances may interfere with amplification.
- Reagent performance: Improper storage, repeated freeze-thaw cycles, or changes in reagent lots may affect reaction efficiency.
- Suboptimal assay conditions: Primer/probe design, reaction chemistry, and thermal cycling parameters can influence amplification.
If Ct values gradually drift between runs, review control trends, reagent lots, storage conditions, and instrument maintenance records.
A consistent increase in Ct across multiple samples may indicate a workflow-level change rather than a problem with individual specimens.
3. Amplification in the No-Template Control (NTC)
Amplification in an NTC can indicate contamination or, in certain assay formats, nonspecific amplification.
Possible causes include:
- Carryover of amplified PCR products from previous runs.
- Contaminated reagents, water, or consumables.
- Cross-contamination during reaction preparation.
- Primer-dimer formation in intercalating dye-based assays.
For dye-based assays, melt curve analysis can help distinguish specific amplification products from some nonspecific products.
How to Reduce PCR Contamination
Maintain separate pre-PCR and post-PCR work areas with dedicated equipment and supplies.
Use aerosol-resistant filter tips, handle reagents carefully, and avoid opening previously amplified reactions in clean preparation areas.
Fresh reagent aliquots and appropriate workspace decontamination may help when contamination is suspected.
For compatible assay chemistries, uracil-DNA glycosylase (UDG/UNG) carryover-prevention systems may also be considered.
4. Poor Replicate Consistency
Large differences between technical replicates can make real-time PCR results difficult to interpret.
Potential causes include inconsistent pipetting, incomplete reagent mixing, bubbles, evaporation, or differences in sample distribution.
To investigate:
- Verify pipette performance and calibration.
- Mix reaction components consistently.
- Confirm that plates or tubes are properly sealed.
- Inspect reactions for bubbles or volume differences.
- Review replicate placement and sample preparation procedures.
At very low target concentrations, greater variability can occur because only a small number of target molecules may be present in each reaction.
This variation should be considered when interpreting results near an assay’s detection limit.
5. Poor PCR Efficiency or Standard Curve Performance
Standard curves help evaluate quantitative PCR performance.
A slope of approximately −3.32 corresponds to 100% amplification efficiency under ideal conditions.
Efficiency between 90% and 110%, with an R² near or above 0.99, is commonly used as a performance target. However, acceptance criteria should follow the specific assay and its validated requirements.
When efficiency falls outside the expected range, investigate:
- Inaccurate serial dilutions.
- Inconsistent pipetting.
- Template inhibition.
- Suboptimal primer or probe performance.
- Incorrect reaction conditions.
Efficiency above 110% may reflect dilution errors, inhibition patterns, or analysis artifacts, while low efficiency may indicate reaction or assay optimization issues.
Prepare fresh standards when necessary and evaluate the full standard curve rather than relying on efficiency values alone.
6. Abnormal Amplification Curves
Not every unusual amplification curve indicates a problem with the PCR chemistry.
Incorrect baseline or threshold settings can affect reported Ct values, while bubbles, poor sealing, and optical interference may affect fluorescence measurements.
Review raw fluorescence data alongside processed amplification plots.
Check that baseline and threshold settings are appropriate for the assay and applied consistently when comparing runs.
Instrument maintenance and optical calibration should follow manufacturer recommendations.
Multiplex RT-PCR Troubleshooting
Multiplex RT-PCR assays detect multiple targets within a single reaction or workflow, introducing additional considerations.
Potential challenges include:
- Target competition: High concentrations of one target may affect amplification of lower-abundance targets in some assay configurations.
- Fluorescence crosstalk: Spectral overlap between fluorophores may create signal interference if instrument settings or calibration are inappropriate.
- Internal control suppression: Certain multiplex reactions may produce weak or absent internal control signals when target concentrations are high.
When one target consistently underperforms, review assay-specific instructions, fluorescence-channel assignments, control behavior, and instrument compatibility.
For custom or laboratory-developed assays, primer/probe concentrations and reaction conditions may also require evaluation.
Best Practices for More Consistent Real-Time PCR Results
Preventing common PCR problems begins with standardized laboratory procedures.
Consider the following practices:
- Maintain separate pre-PCR and post-PCR work areas.
- Use appropriate positive, negative, and internal controls.
- Store reagents according to manufacturer instructions.
- Minimize unnecessary freeze-thaw cycles.
- Maintain and calibrate pipettes and instruments.
- Document reagent lots and protocol changes.
- Monitor control Ct values for unexpected trends.
- Confirm nucleic acid extraction quality and downstream compatibility.
- Use consistent plate setup and sample handling procedures.
Standardized reaction formats may also help reduce repetitive handling steps and improve workflow consistency.
For example, pre-plated RT-PCR panels can simplify portions of reaction setup by providing assay-specific primers and probes in a predefined plate configuration.
Supporting More Consistent RT-PCR Workflows with Jant Pharmacal
Jant Pharmacal offers Accutest® Standard Multiplex and Custom Pre-Plated RT-PCR Panels for molecular research applications.
Accutest Custom Pre-Plated RT-PCR Panels
Accutest Custom Pre-Plated RT-PCR Panels allow laboratories to select targets based on their research requirements.
Primers and probes are pre-spotted in each well, with MasterMix included in the current custom-panel configuration.
Available options include:
- 96-well and 384-well plate formats.
- Clear or white plate configurations.
- Customizable target selections.
- Applications covering respiratory, gastrointestinal, urinary tract, antibiotic resistance, sexual health, women’s health, nail fungus, and wound research.
Panel selection and configuration should be reviewed according to the intended workflow, instrument compatibility, and assay requirements.
Complete Your Molecular Research Workflow
In addition to custom and standard multiplex RT-PCR panels, Jant Pharmacal offers nucleic acid extraction solutions and other real-time PCR products.
Explore Custom Pre-Plated RT-PCR Panels
Contact Jant Pharmacal to Discuss Your RT-PCR Requirements
Frequently Asked Questions
Why are my Ct values higher than expected?
Higher Ct values may result from low template concentration, degraded nucleic acids, PCR inhibitors, reagent changes, or suboptimal amplification conditions. Reviewing control results and extraction quality can help identify potential causes.
What does amplification in a no-template control mean?
NTC amplification may indicate contamination from reagents, samples, or previous PCR products. In dye-based assays, primer-dimers or other nonspecific products can also produce fluorescence signals.
What is acceptable PCR efficiency?
An efficiency range of approximately 90–110% is commonly used in qPCR workflows, with 100% efficiency corresponding to a standard curve slope near −3.32. Acceptance criteria depend on the assay and its validation requirements.
How can I identify PCR inhibition?
Unexpected internal control behavior, delayed amplification, or abnormal dilution responses may suggest inhibition. Appropriate control and dilution studies can help assess inhibition, provided results are interpreted according to assay requirements.
Conclusion
Real-time PCR troubleshooting requires a systematic approach to identifying problems with samples, extraction, reagents, reaction setup, and instrument performance.
Reviewing controls, monitoring Ct trends, and maintaining consistent laboratory procedures can help reduce variability and identify problems before they affect additional runs.
Jant Pharmacal offers molecular extraction products, standard multiplex panels, and customizable pre-plated RT-PCR solutions to support research laboratories.
Request Information or a Quote from Jant Pharmacal
The molecular research products discussed in this article are for Research Use Only (RUO) unless otherwise specified. RUO products are not intended for use in diagnostic procedures. Refer to individual product documentation for intended use.
References
- Bustin SA, et al. MIQE 2.0: Revision of the Minimum Information for Publication of Quantitative Real-Time PCR Experiments Guidelines. Clinical Chemistry. 2025;71(6):634–651. https://doi.org/10.1093/clinchem/hvaf043
- Schrader C, Schielke A, Ellerbroek L, Johne R. PCR inhibitors – occurrence, properties and removal. Journal of Applied Microbiology. 2012;113(5):1014–1026.